140 Trades in the Open: LiquidMind's First Public Ledger
We close every position in public — the winners and the losers — on X and Telegram, in real time. This is the first time we've stepped back and asked the harder question: across the entire life of the engine, what do the numbers actually say?
This is the aggregate. Not a highlight reel, not a per-trade replay. Every closed trade LiquidMind has taken since inception, added up, sliced, and stress-tested. It's occasioned by the June close, but it covers everything from the first fill onward — because the story that matters isn't one month, it's the arc.
The one-line version: +49.8% return on capital in ~4.5 months, delivered through a 42.9% win rate, a drawdown that erased more than half of all profit earned to date, and a 12-trade losing streak. The edge here is asymmetry, not accuracy — and that distinction is the whole post.
The headline numbers
Period: Feb 16 → Jun 30, 2026 (~4 months, 15 days). Starting capital: 50,000 USDT.
| Metric | Value |
|---|---|
| Trades | 140 |
| Net PnL | +24,876.87 USDT |
| ROI (on starting capital, not annualized) | +49.8% |
| Win Rate | 42.9% |
| Profit Factor | 1.42 |
| Realized R-multiple (total) | +25.62R |
| Avg realized R:R | 0.18R |
| Recovery Factor | 1.72 |
Read those together and the picture is specific: the engine is wrong more often than it's right, but its winners are meaningfully larger than its losers. A profit factor of 1.42 means every unit of loss is offset by 1.42 units of gain. That's the entire business model — survive the misses, size the hits.
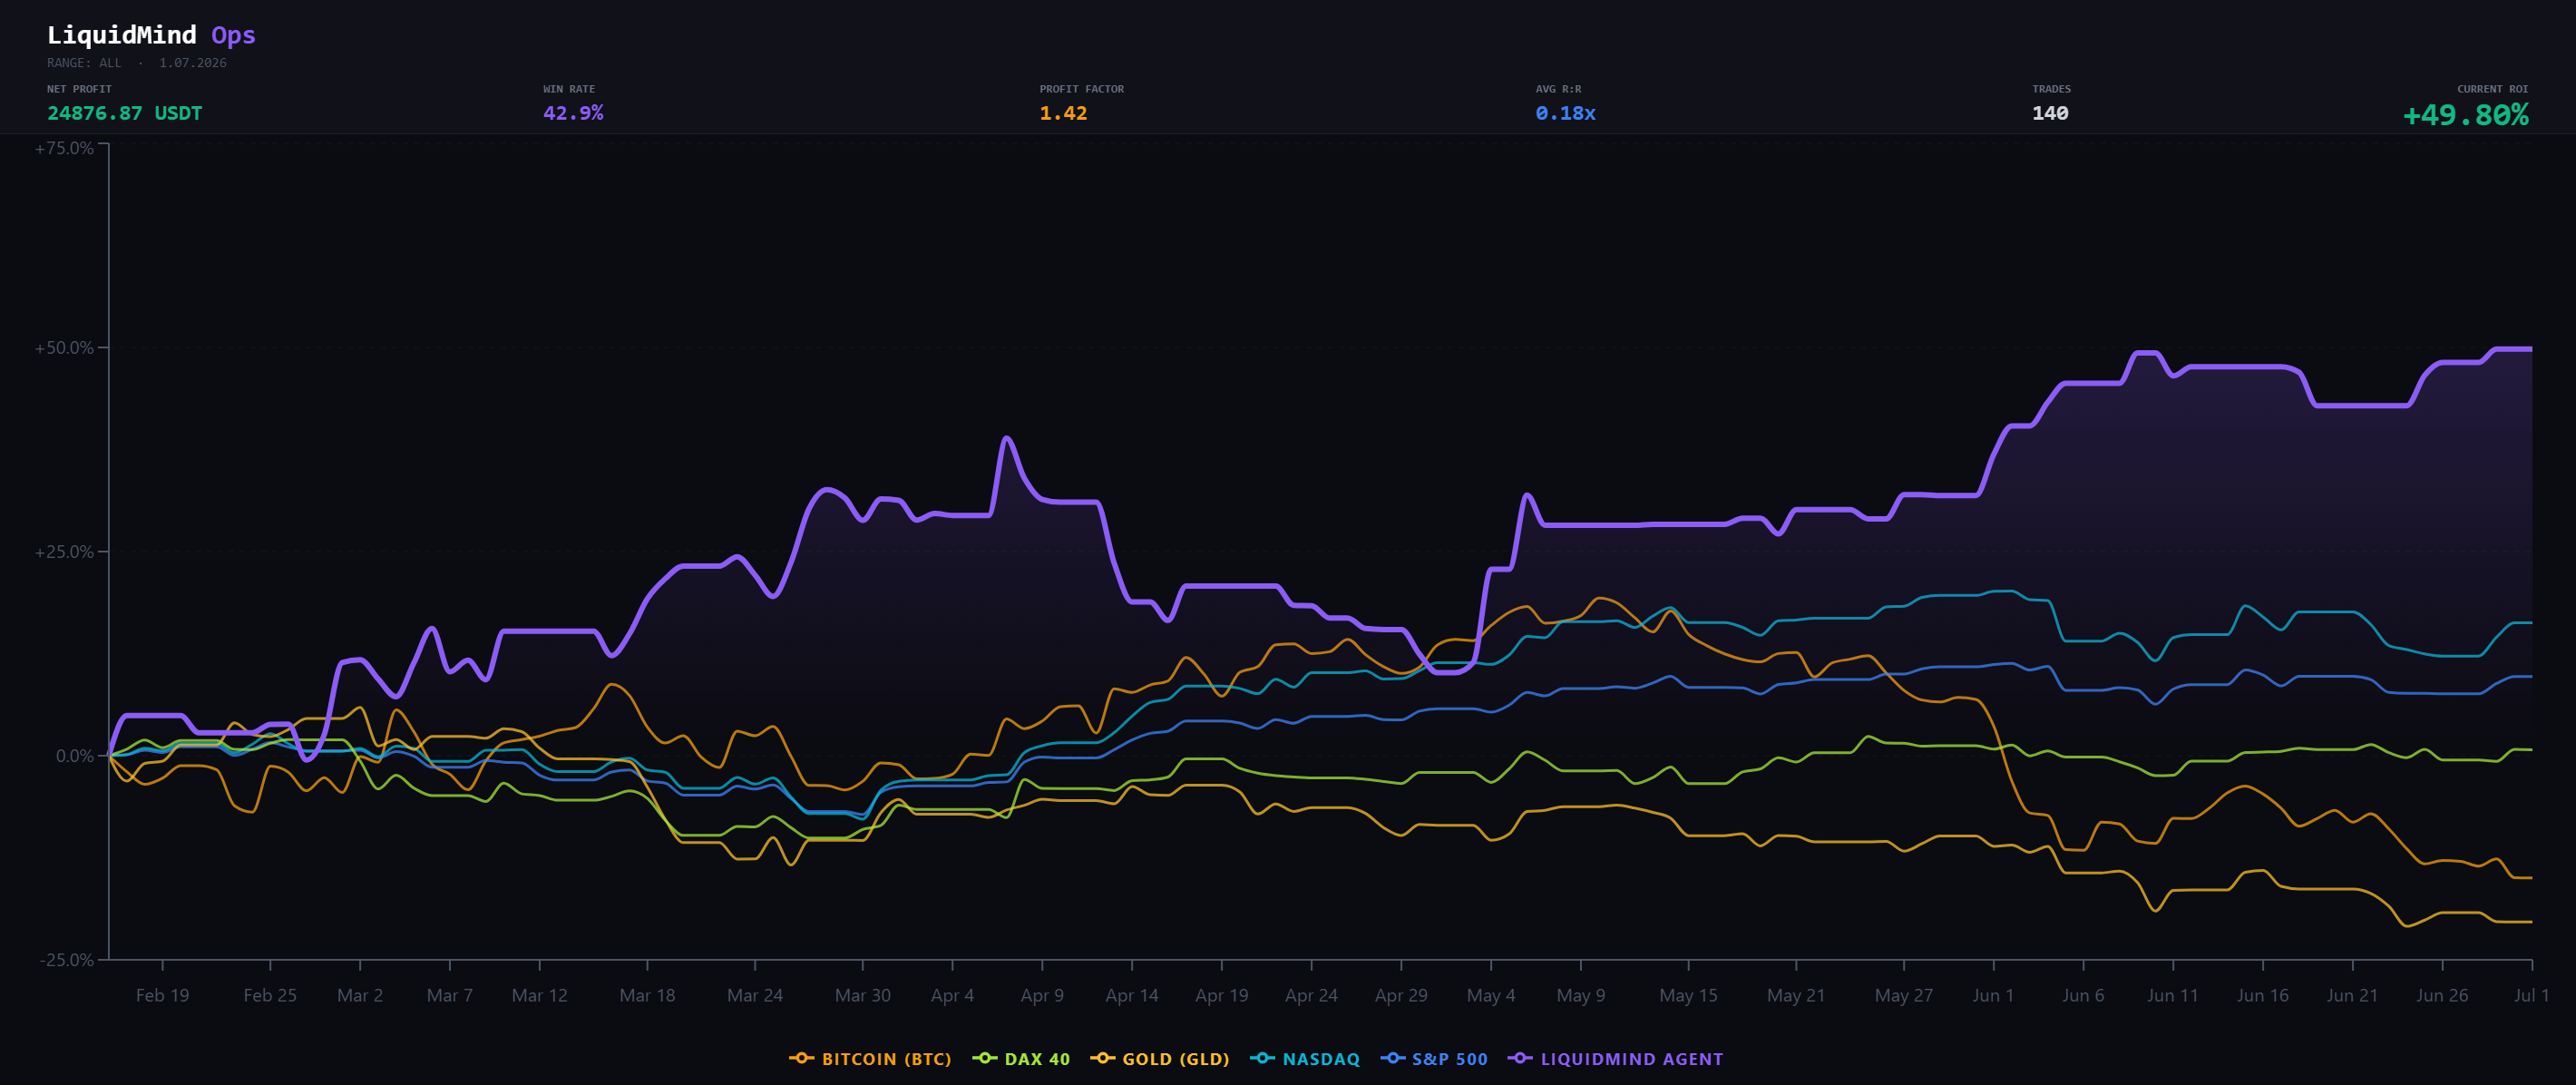
Cumulative ROI of the LiquidMind agent (purple) vs. buy-and-hold benchmarks over the same window.
What "beating the market" actually meant here
The chart above isn't just our equity curve — it's our equity curve against what you'd have made holding anything else over the identical window.
Over these ~4.5 months, buy-and-hold roughly delivered: BTC ≈ −15%, Gold ≈ −20%, DAX 40 ≈ +1%, S&P 500 ≈ +10%, NASDAQ ≈ +16%. LiquidMind closed at +49.8%.
The point isn't the outperformance number in isolation — 4.5 months is a short window and we won't pretend otherwise. The point is the shape: the engine made money while BTC lost it, because it takes shorts as readily as longs and its returns aren't a leveraged bet on crypto going up. That's the property that makes an engine worth running instead of just holding spot — low correlation to the thing everyone else is already long.
The 4.5-month arc
The aggregate hides the story. Broken out by month, the engine went through a full cycle — ramp, blow-off, drawdown, recovery — inside its first four and a half months.
| Month | Trades | PnL | Win Rate | PF | Avg RR |
|---|---|---|---|---|---|
| Feb (partial, from the 16th) | 12 | +1,267 | 33.3% | 1.20 | 0.12R |
| Mar | 58 | +14,426 | 46.6% | 1.71 | 0.24R |
| Apr | 36 | −9,493 | 25.0% | 0.54 | −0.26R |
| May | 18 | +9,709 | 55.6% | 2.63 | 0.57R |
| Jun | 16 | +8,967 | 62.5% | 2.49 | 0.61R |
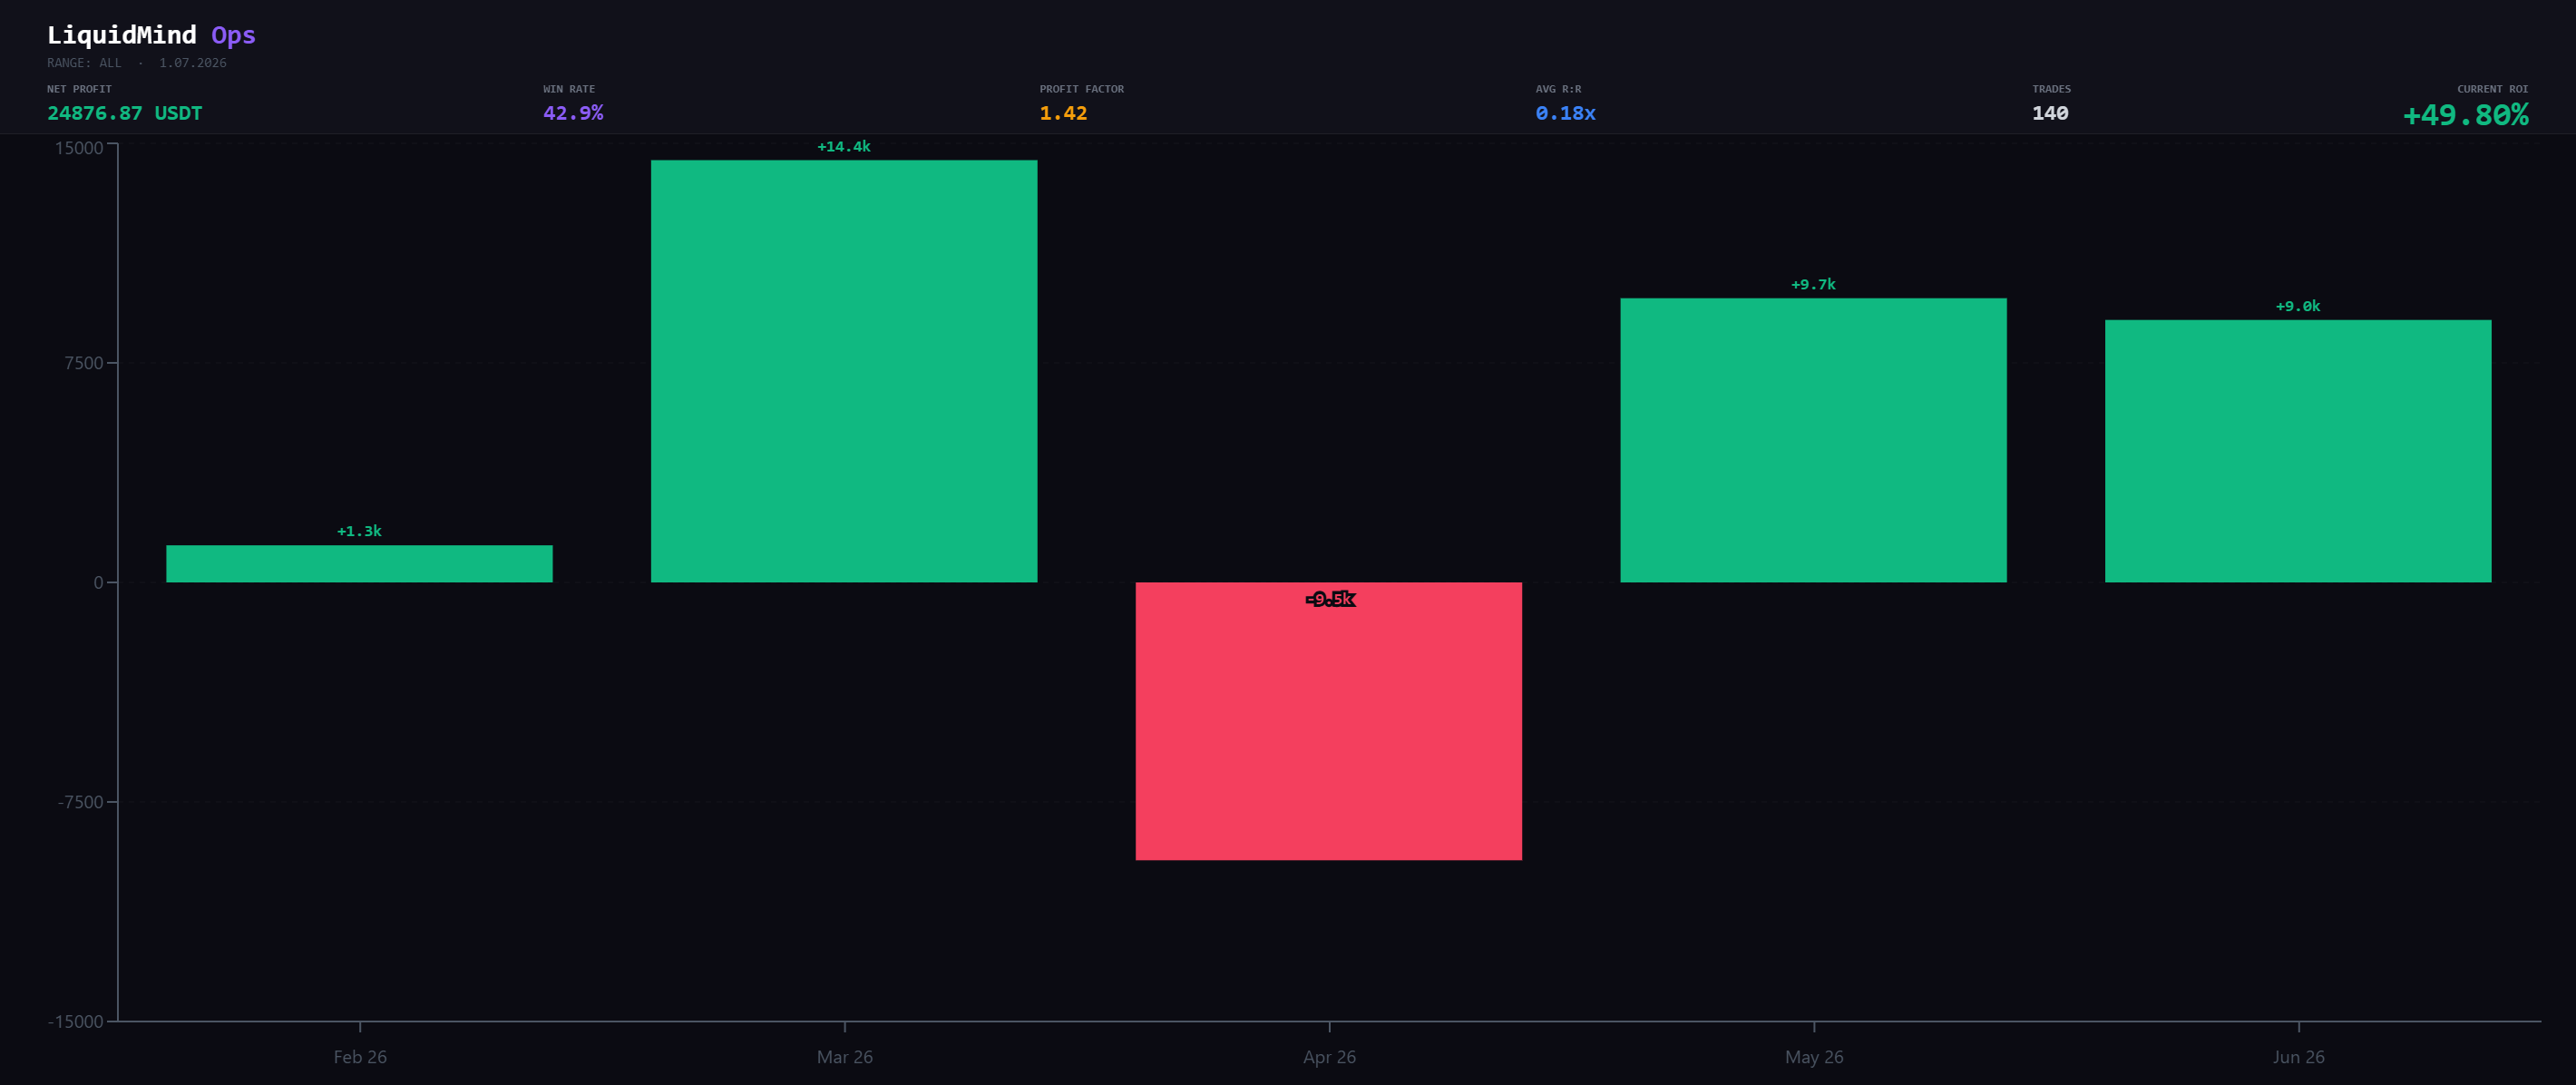
Monthly net PnL. March carried the first half of the year; April gave a third of it back.
A few things worth naming honestly:
- March was the volume month — 58 trades, nearly half the entire history, and the single biggest PnL contribution. When the engine is in a regime it likes, it presses.
- April was the reckoning. Win rate collapsed to 25%, profit factor fell below 1.0 (0.54 — the system lost money on every unit risked), and the month printed −9,493 USDT. This is the month we study, not the ones we frame.
- May and June are the recovery — profit factor of 2.63 then 2.49, win rate climbing to 55.6% then 62.5%. Fewer trades, higher quality. More on why below, with the appropriate caveats.
Note the trade count falling from 58 → 36 → 18 → 16. That's not the engine running out of signals. It's selectivity going up. Whether that's a durable behavioral change or just a calmer market is exactly the kind of thing we refuse to declare from two months of data.
The drawdown, in full
If you take one thing from a transparency post, it should be the losing side. Here it is without softening.
| Metric | Value |
|---|---|
| Max drawdown | −14,498.51 USDT / −13.87R |
| Drawdown as % of peak equity | ≈ −22% |
| Drawdown period | Apr 8 → May 1, 2026 (24 days) |
| Trades to recover | 19 |
| Longest losing streak | 12 trades (−11,293.64 USDT / −10.65R) |
| Longest winning streak | 6 trades (+8,833.33 USDT / +9.51R) |
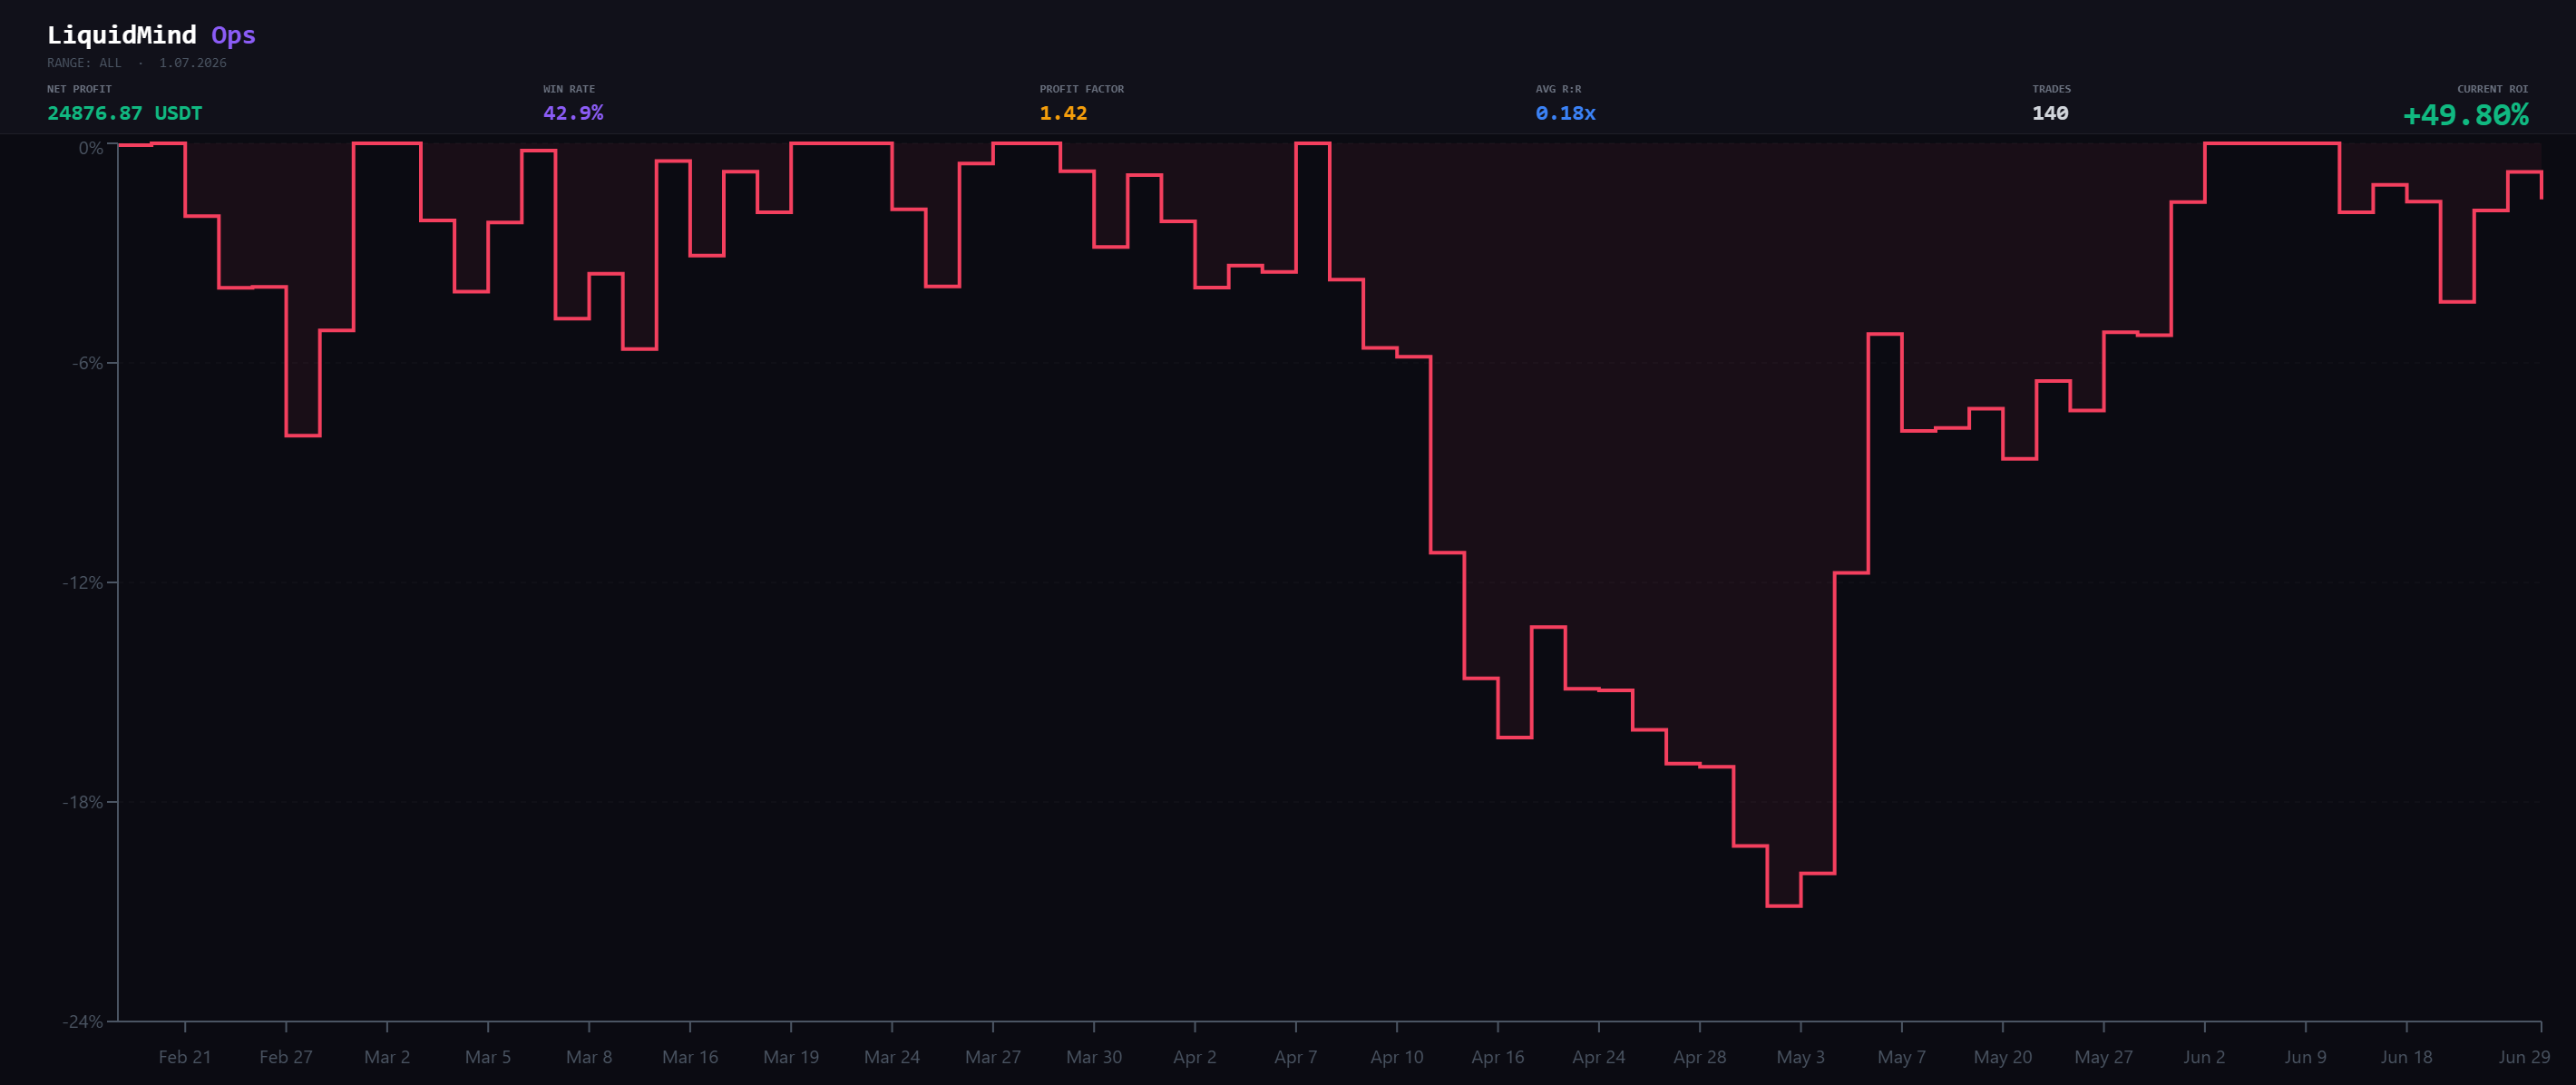
The underwater curve. The April trough is the one that matters.
To put the magnitude in perspective: the deepest drawdown erased an amount equal to ~58% of the entire net profit the engine has ever generated. It took 24 days and 19 trades to climb back out.
And the streak deserves its own paragraph, because it's the part most systems hide. Twelve losing trades in a row. At a 42.9% win rate, an i.i.d. model puts a 12-trade losing run at roughly 0.12% — about 1 in 830. It happened anyway. That's the lesson: real losing trades don't arrive independently, they cluster in adverse regimes. The streak your naive probability says is nearly impossible is the streak you have to be capitalized and psychologically prepared to sit through. If a −10.65R run would end you — on capital or on nerve — the strategy isn't wrong, your sizing is.
Cadence: the weekly view
Zoom into weeks and you can see the same story at higher resolution — including the four-red-week cluster through April and the single explosive week (May 4) that started the recovery.
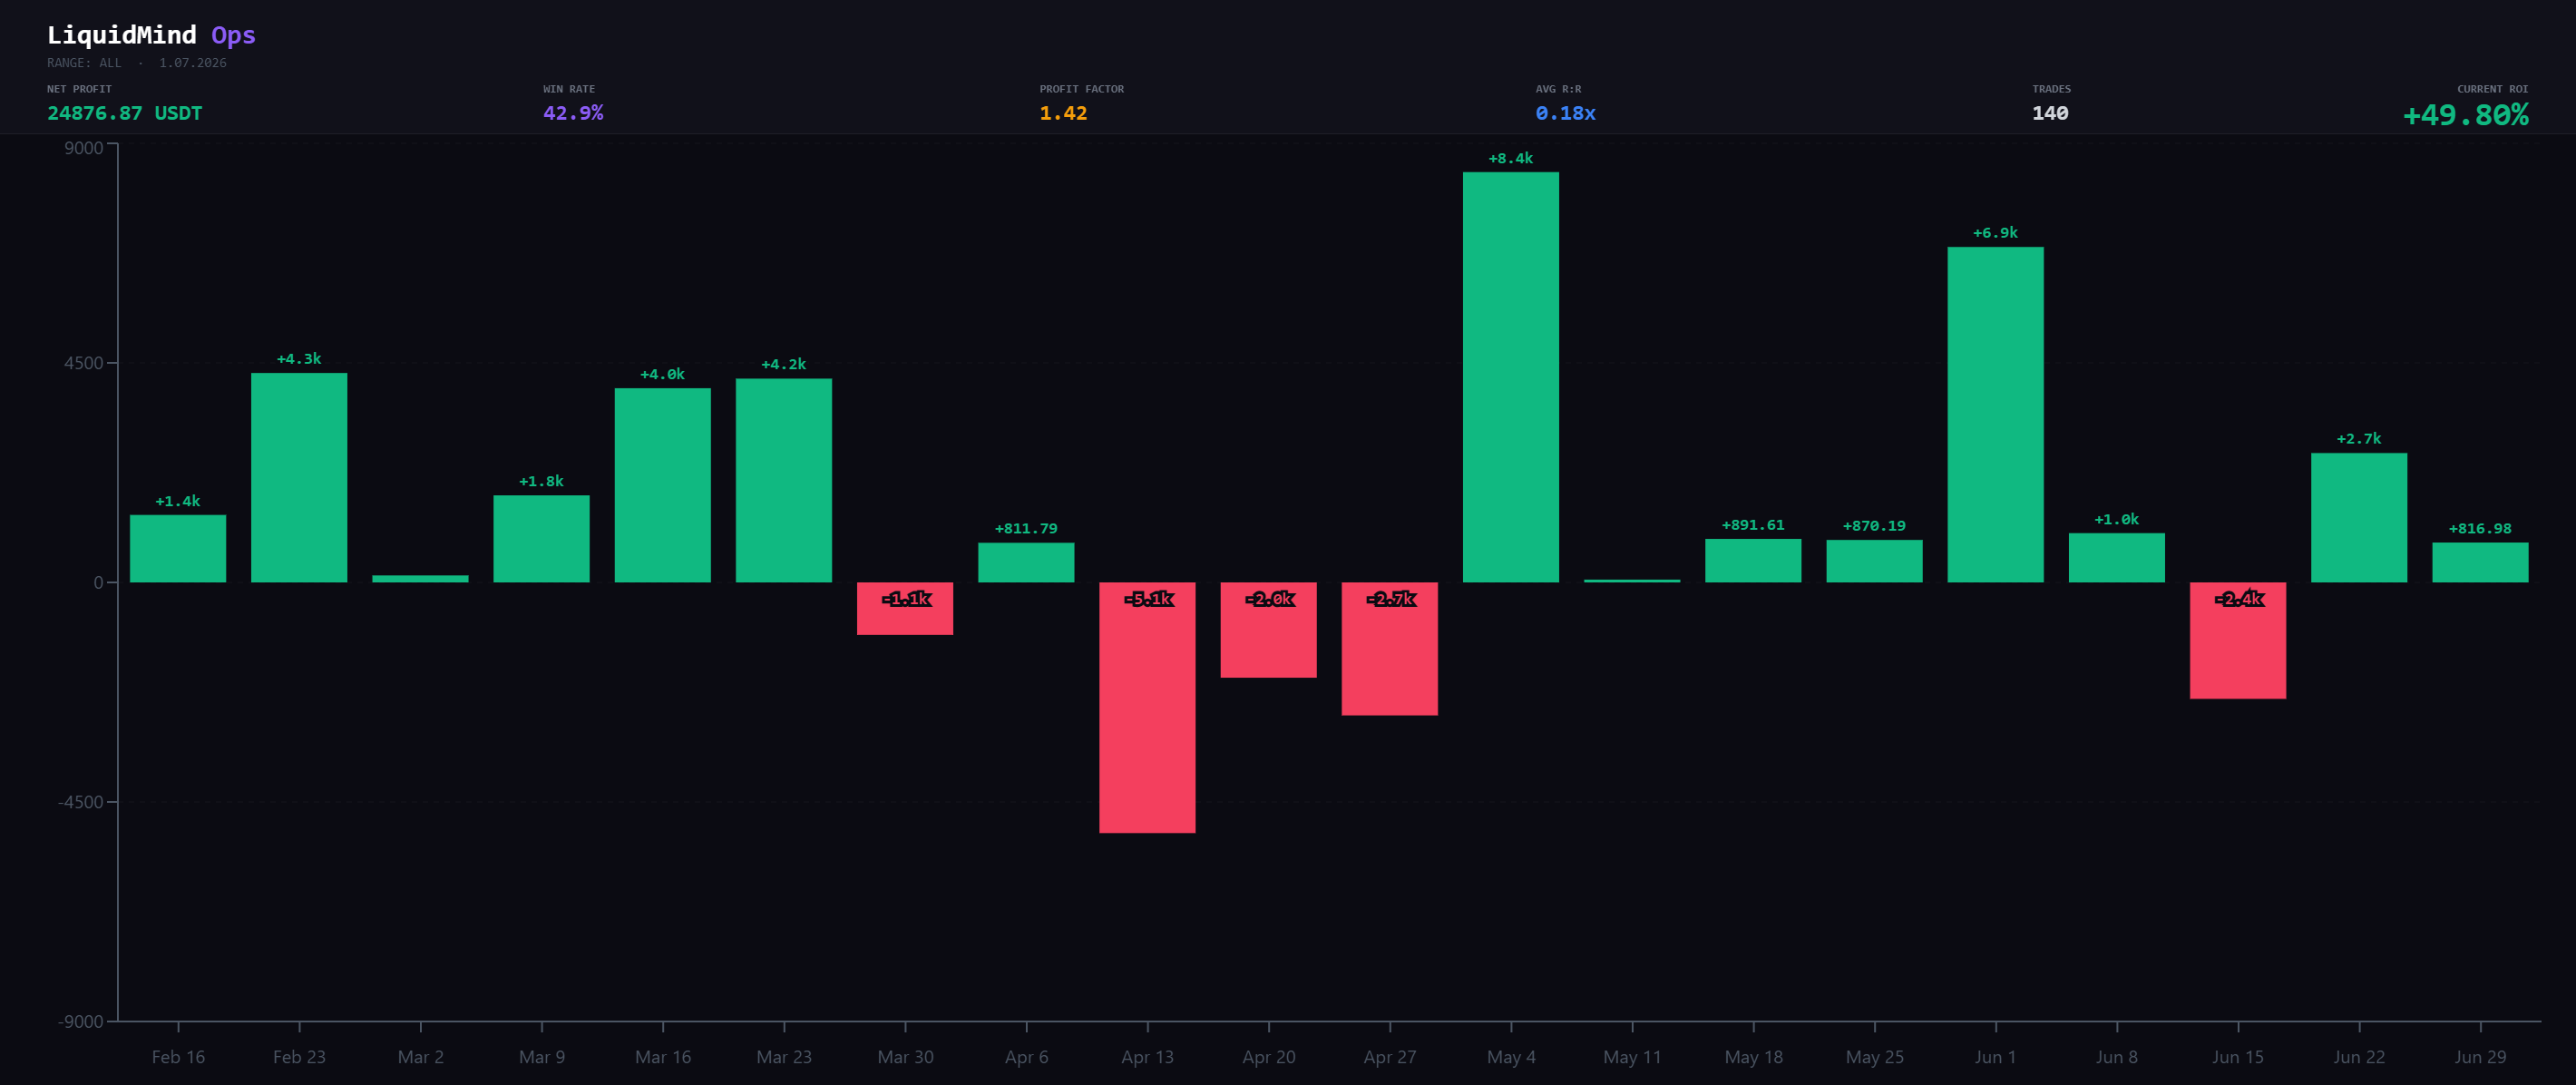
Weekly net PnL. The biggest single week (early May) roughly equals the entire April drawdown — recovery is lumpy, not linear.
The takeaway from the weekly bars isn't any single week. It's that the equity curve advances in jumps. A small number of weeks carry the result; most weeks are noise around flat. If you were watching this account week to week and bailed after the April cluster, you'd have missed the week that paid for it. Consistency at the trade level is a fantasy; the job is to still be in the seat when the fat weeks land.
Where the edge actually lives
Now the part traders actually want: which setups carry the book, and which ones bleed it.
A warning before the table. Several of the strongest-looking entries are on tiny samples — a 100% win rate on 3 trades is a coin that's landed heads three times, not a validated edge. We're aggregating by POI type where we can, and flagging small-n explicitly. Treat n < 10 as a signal, not a conclusion.
Top 3 setups by the numbers:
🥇 SHORT 4H BPR — 80% WR (n=5), +1.72R expectancy, +$7,703 PnL
🥈 SHORT 1D EQH — 100% WR (n=3), +1.03R expectancy, +$3,038 PnL
🥉 LONG 1H BPR — 45.5% WR (n=11), avg win +2.71R, +$9,969 PnL — the only workhorse with n>10
#1 ranked by expectancy. #2 by perfect win rate. #3 by raw PnL — and the only entry with enough sample size to half-trust.
What the data leans on:
- BPR is the backbone. It's the single most productive POI family across the book — it shows up in three of the top-five setups (LONG 1H BPR at +9,969 USDT over 11 trades, SHORT 4H BPR at +7,703, SHORT 1D BPR at +1,859). Of everything the engine trades, BPR is the pattern pulling the most weight, and it's the one entry family with enough trades behind it to half-trust.
- 1H FVG shorts are the drag. SHORT 1H FVG: 7 trades, 28.6% win rate, −0.18R expectancy, −1,943 USDT. This is the clearest negative-expectancy combination in the entire history, and it's a live candidate for the same treatment we gave BREAKER POIs (see below).
- The 100%-WR entries are early signals only. SHORT 4H BPR (80% on 5), SHORT 1D EQH (100% on 3), SHORT 1D BPR (100% on 3) all look elite and all sit on samples too small to bank. We're watching them; we're not building a thesis on them yet.
The honest summary: do more BPR, question 1H FVG shorts, and don't fall in love with a three-trade streak.
(A full setup-by-setup table, with every sample size shown, is in the appendix at the end of this post.)
What we changed, and what we won't claim
Around the April drawdown we shipped several changes to the engine:
- a RAG layer giving the analysis agent retrieval over the trade corpus and market context,
- a daily-bias agent to set directional context before POIs are evaluated,
- and we pulled BREAKER POIs out of processing entirely — they weren't earning their place.
In the two months that followed, win rate, profit factor and average R all improved. It would be easy — and dishonest — to draw a straight line from those changes to that improvement. We won't. May and June are 18 and 16 trades. That's not enough to separate "the changes worked" from "the market got friendlier." What we can say is precise: we changed X, Y and Z; here is what happened next; here is what we're watching to find out whether it holds. Correlation, logged in public, is worth more than a causal story we can't yet defend.
The BREAKER removal is the cleanest example of the philosophy: a POI type that consistently underperformed got cut, not tuned. The 1H FVG short is next in the crosshairs for the same reason.
How these numbers were produced
Every figure in this post was computed by LiquidMind's built-in analysis agent. It has direct, read-access to the full trade corpus and answers questions by calling specific analytical tools — drawdown reconstruction, per-setup expectancy, streak analysis, regime slicing — rather than us hand-rolling a spreadsheet. Ask it "what's the worst setup by expectancy" or "reconstruct the max drawdown window" and it queries the ledger and returns the breakdown.
That's the same capability that makes retrospectives like this one cheap to produce and hard to fake: the numbers come straight off the same trade log that streams to X and Telegram in real time. There's no separate "marketing" dataset. The event log is the ledger.
The honest forward look
June's 62.5% win rate is the best month on the board. It's also 16 trades. We'd be doing exactly what we just warned you against if we told you that's the new baseline. The realistic read: the engine has shown it can rip in a good regime (March, May, June), and it has shown you precisely what a bad regime costs (April). Both are real. Both will happen again.
If you're following along, the number to watch isn't the ROI — it's whether the profit factor holds above 1.4 through the next April. That's the only test that matters.
Everything above is auditable in real time. Positions, entries, exits, PnL — live on X and Telegram, losses included, as they close.
Want to verify the numbers yourself? The live account is open for inspection — every trade, every reasoning trace, read-only: View the live account →
Not financial advice. Past performance is not indicative of future results, and 4.5 months is a short track record — treat it as one.
Appendix: full setup table
Sample sizes shown for every row. Anything under 10 trades is an early signal, not a validated edge.
| Setup | Trades | Win Rate | Expectancy | PnL (USDT) | Note |
|---|---|---|---|---|---|
| SHORT 4H BPR | 5 | 80.0% | +1.72R | +7,703 | n<10 — signal |
| SHORT 1D EQH | 3 | 100% | +1.03R | +3,038 | n<10 — signal |
| LONG 1H BPR | 11 | 45.5% | +0.91R | +9,969 | highest PnL; workhorse |
| LONG 4H CLUSTER | 5 | 60.0% | +0.91R | +4,632 | n<10 — signal |
| SHORT 1D BPR | 3 | 100% | +0.57R | +1,859 | n<10 — signal |
| SHORT 4H EQH | 6 | 50.0% | +0.35R | +2,813 | positive, thin sample |
| SHORT 1H EQH | 5 | 40.0% | −0.06R | −311 | negative expectancy |
| SHORT 1H FVG | 7 | 28.6% | −0.18R | −1,943 | worst combo — review |
Expectancy is per-trade in R. Positive expectancy on a small sample is encouraging, not conclusive.
sc4mp
Founder of LiquidMind. Trading ICT/SMC concepts with AI-assisted tooling. Writing about what I build, what I break, and the trades that teach me the most.
@sc4mpStay in the loop
New posts on transparency, engineering, and the LiquidMind thesis — no noise.
Discussion
Sign in to join the discussion.